MOMO Pro+ Advanced
MOMO Pro+ Algorithms and Capabilities available in Pro+ and above
These enhancements are implemented in Discovery and Notifications components and build on Discovery and Notifications. It is highly recommended you review the MOMO Pro+ Base and other sections as the functional overviews are not repeated here.
MOMO Vector
MOMO Vector is a VWAP-derived indicator and our most recent algorithmic addition. MOMO Vector simplifies screening for momentum breakouts of any velocity. It is highly responsive and works equally well across all our available timeframes (from 1 min to 1 month).
With VWAP as part of MOMO Vector's DNA, volume and price are needed to influence the value. Increasing volume and increasing price will more strongly influence the value than only one of the elements. When trying to identify quick moves that are validated with volume, MOMO Vector is an ideal indicator. The valid values for Vector are -10 to +10, with -10 being most bearish and +10 being most bullish. As with all our indicators, you can refine your screening further by combining multiple indicators.

About MOMO Vector
MOMO Vector simplifies finding meaningful momentum moves regardless of price or timeframe. It utilizes latent elements of VWAP to provide a score based value to highlight momentum. See our blog for a deeper dive.
MOMO Squeeze
MOMO Squeeze provides TTM Squeeze scanning across the entire market to view stocks currently in a "squeeze" pattern, breaking out of squeeze or post-squeeze. MOMO Squeeze can be used across all timeframes and also with filters to provide custom views using available Discovery columns as filter criteria. Click on the MOMO Squeeze heading to toggle through the 5 different sort order and states.
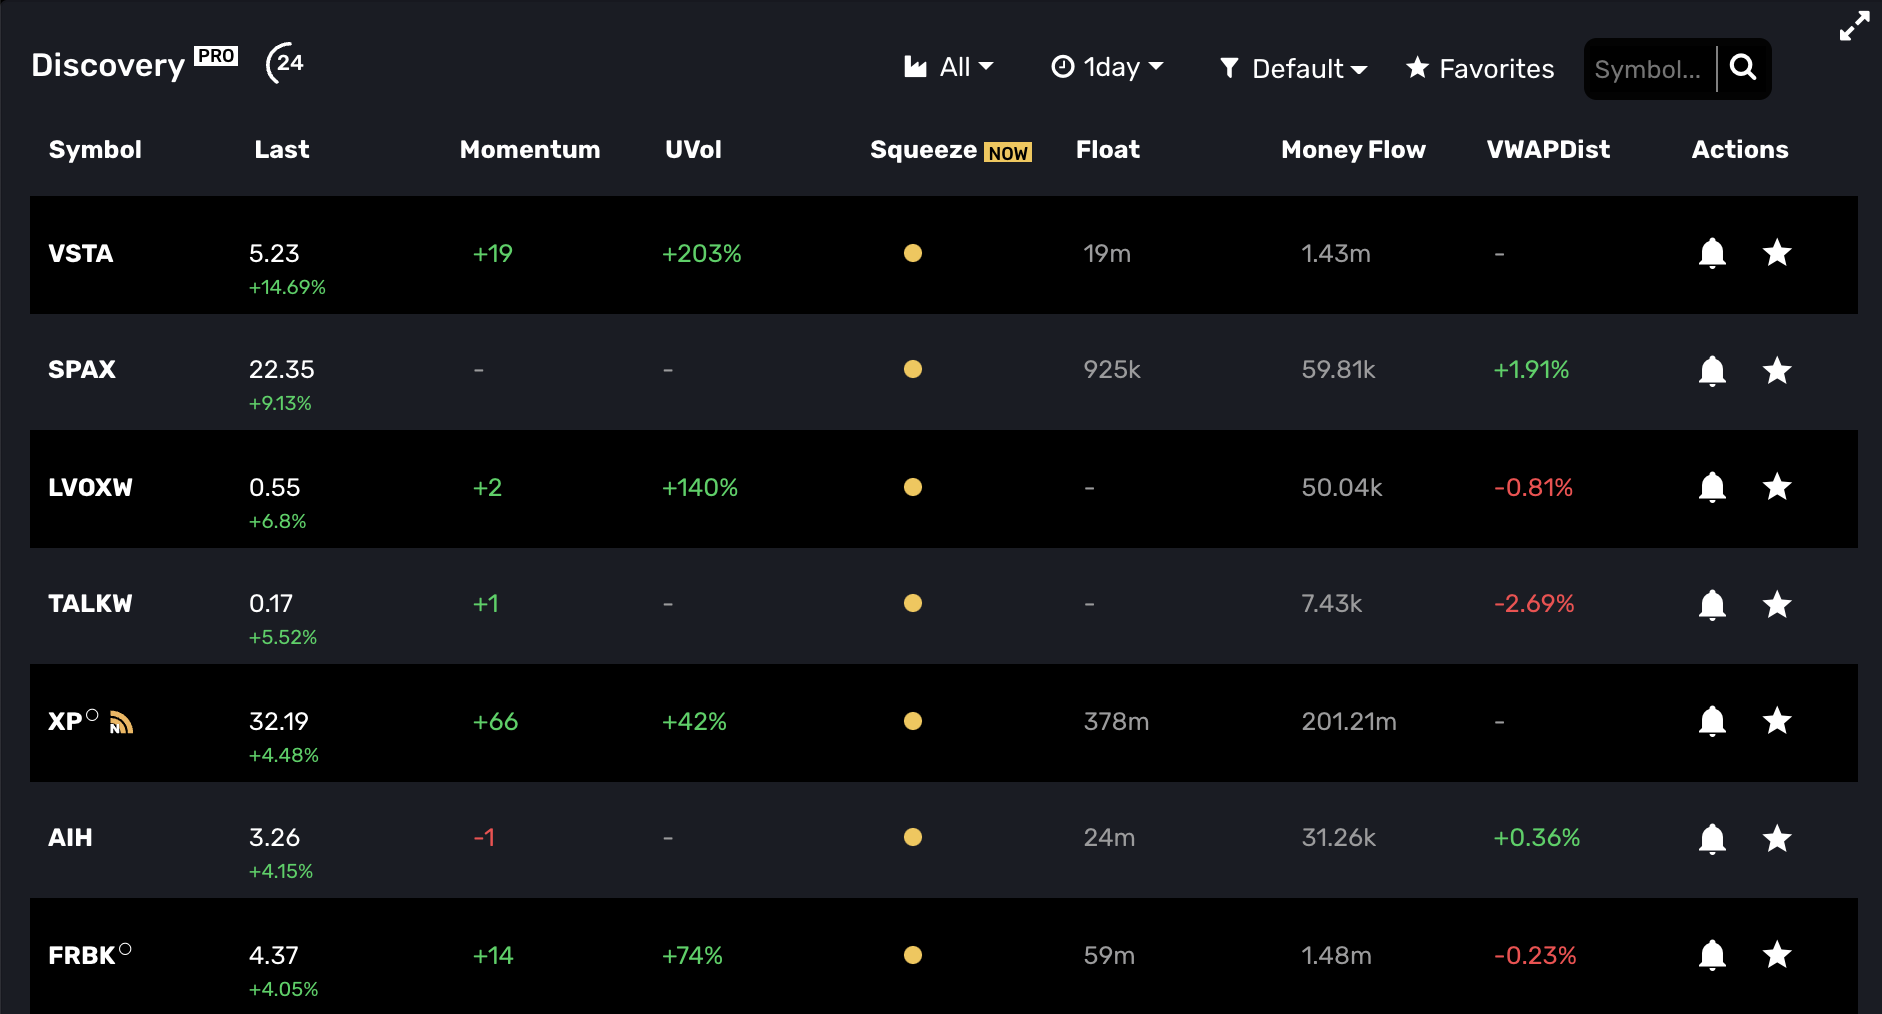
About MOMO Squeeze
MOMO Squeeze is a very powerful indicator and complements unusual volume to identify stocks in an imminent breakout. Our implementation is refined to work across all timeframes, but given the algorithmic complexity, it may include some noise - particularly with low-volume stocks trading with shorter timeframes (15 minutes to 2 hours). MOMO Squeeze utilizes the TTM Squeeze approach and utilizes Keltner channels, Bollinger bands, EMA and average true range (ATR) to determine the squeeze states of each stock. All positions across the entire market are recalculated every 60 seconds.
MOMO Trend
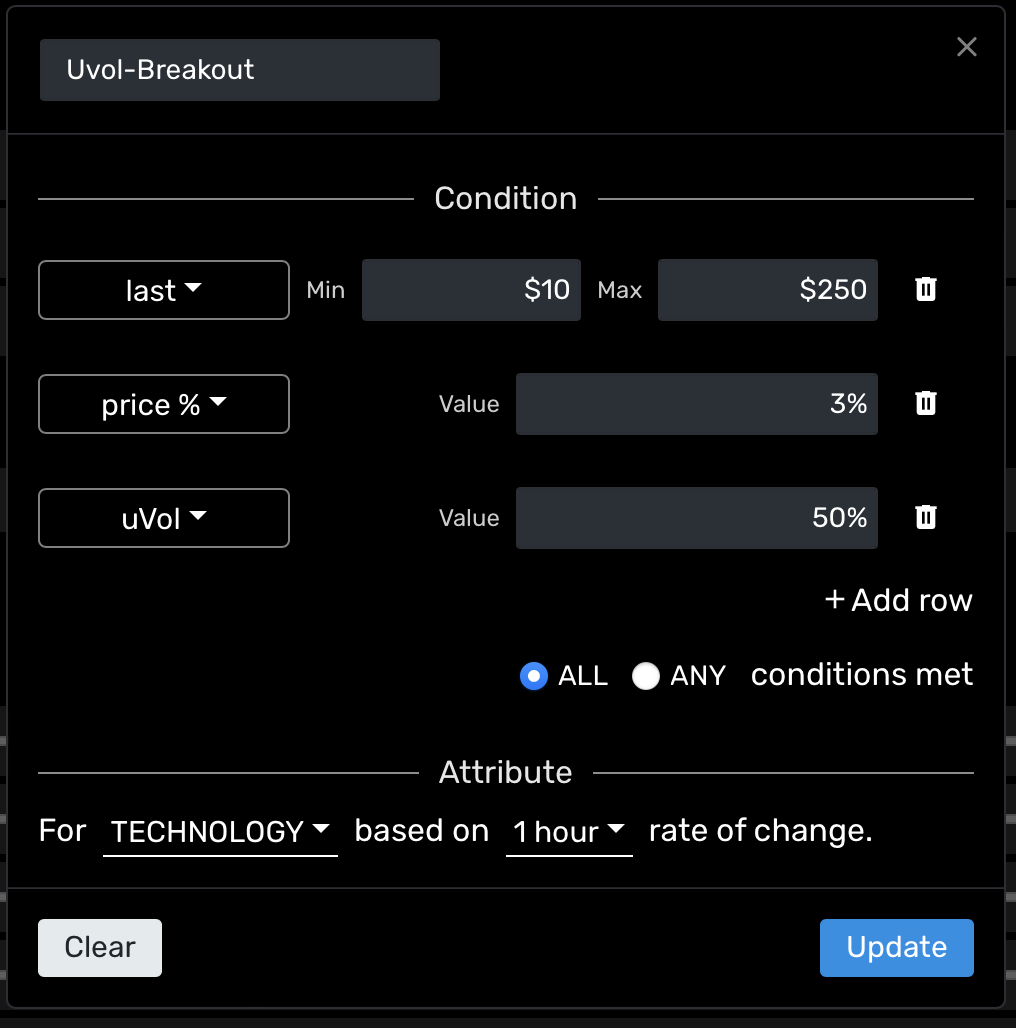
MOMO Trend provides a timeframe-based scan of equities' direction across an entire market. If you have used Supertrend on charting applications, you will see strong similarities. MOMO Trend provides a scan-based view of upward and downward bias as well as price point where the trend pivots across each timeframe. Advanced filters can be used to scan based on MOMO Trend and any of the other indicators based on your trading style. As an example, a filter could be set to show "MOMO Trend = "Buy" AND Uvol = > "50%" and Price > "3%".
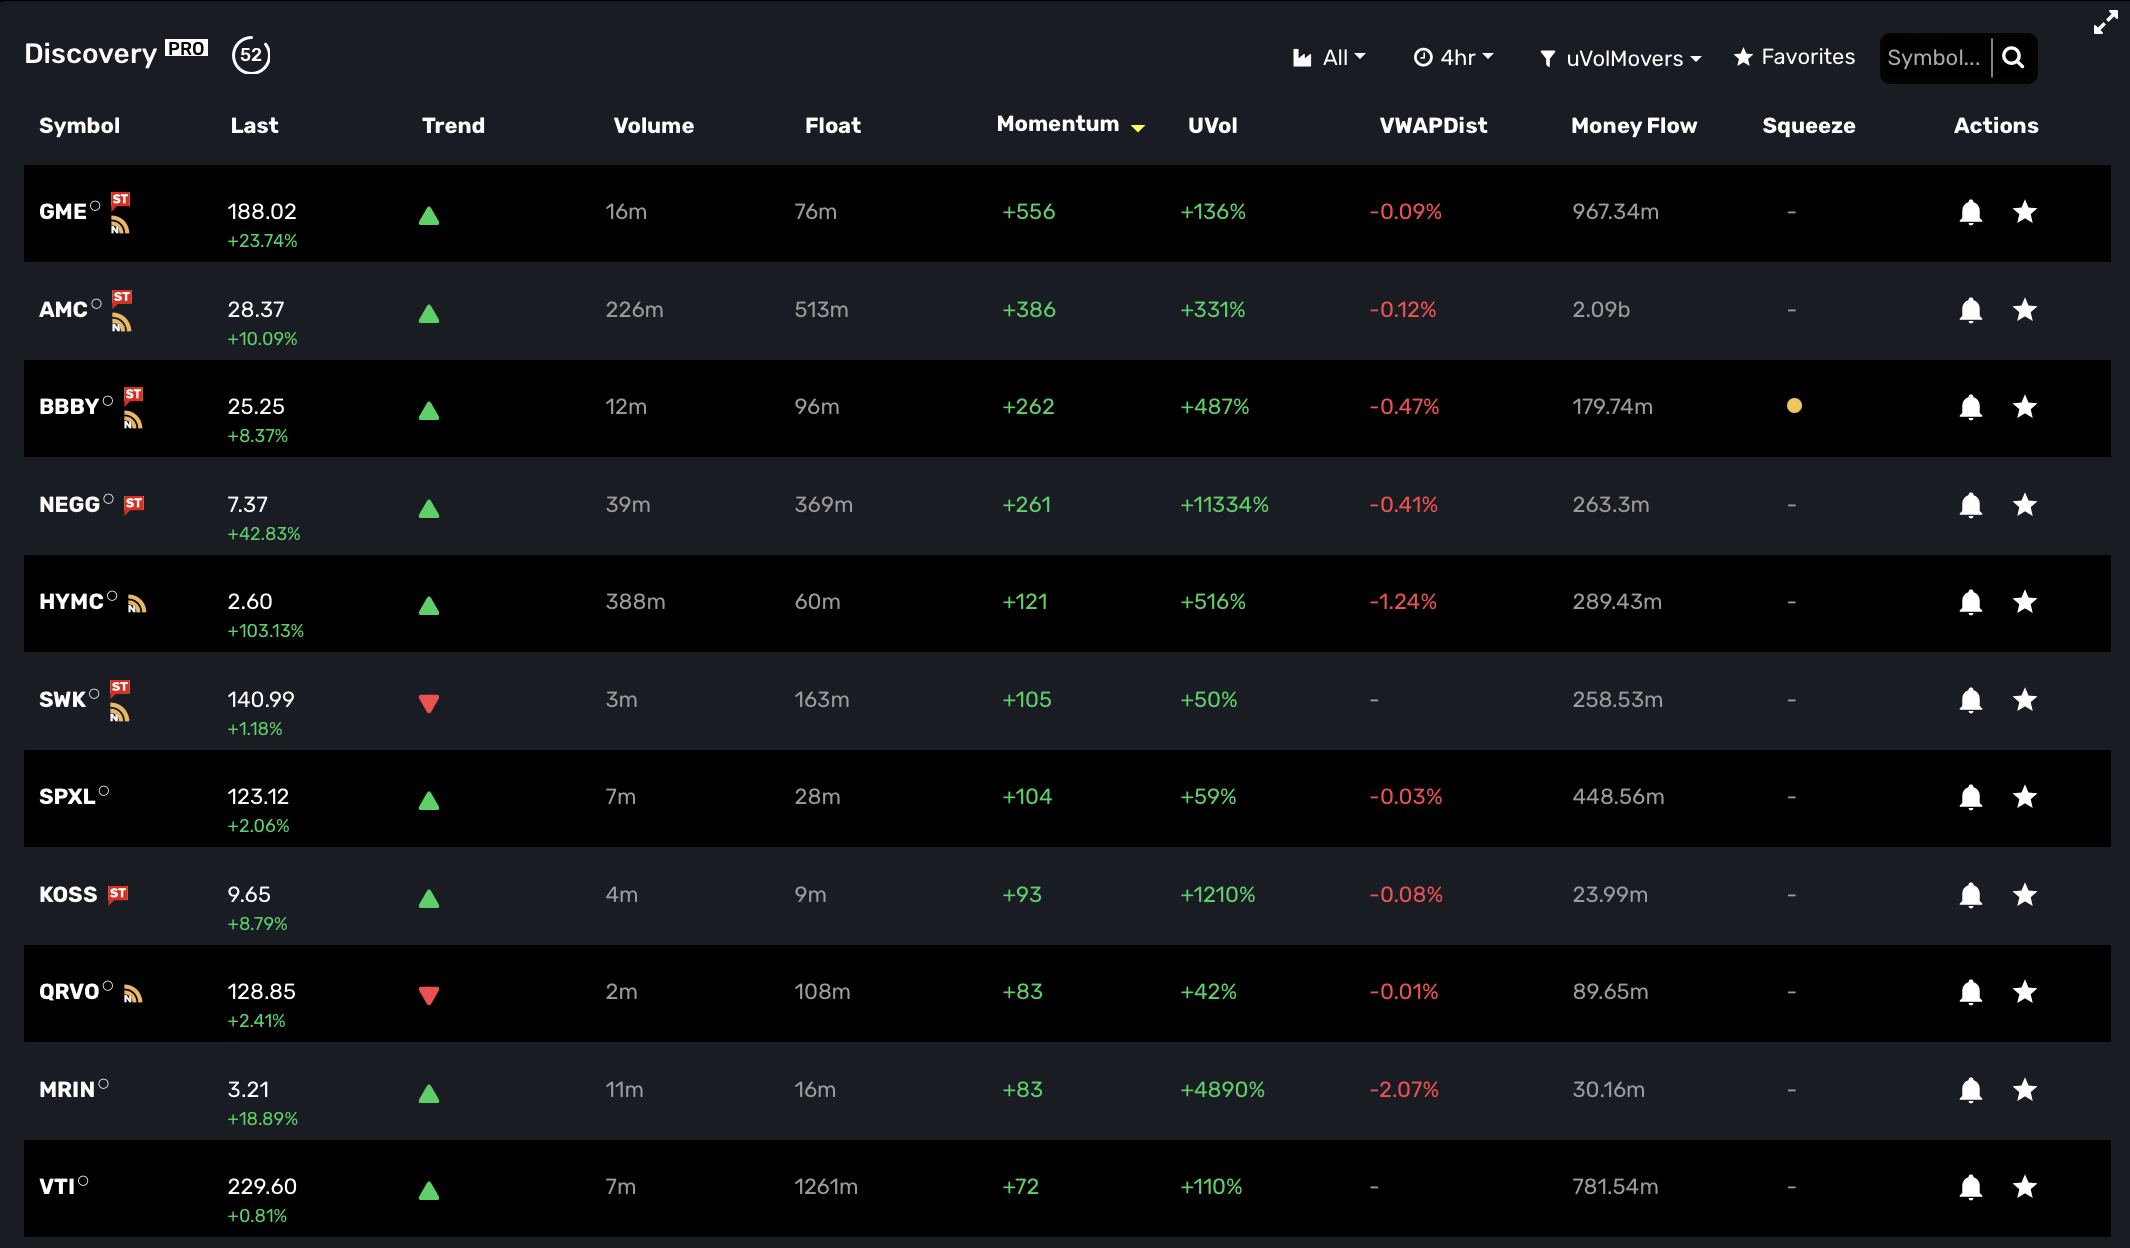
As with MoneyFlow, you can click the symbol's trend icon to reveal the price when the trend changes. This is valuable for establishing stops and entry points and is timeframe-dependent.
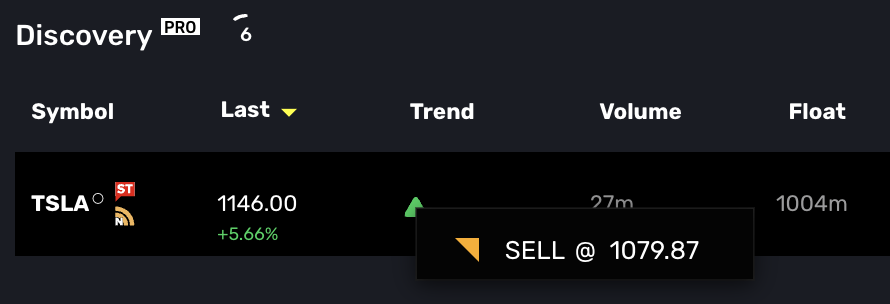
About MOMO Trend. The algorithm behind MOMO Trend and Supertrend have become known for their reliability in providing accurate trend direction as well as entry and exit points. Prior to MOMO Trend, it was labour-intensive using charts to get directional insight. Where basic smoothed average trend indicators provide a basic understanding of directional bias, MOMO Trend incorporates volatility to maximize trading profits by letting "runners run" and closing positions before big trend changes. MOMO Trend is highly complementary to other MOMO indicators and is fully implemented throughout the platform with availability in both Discovery Filters and Conditional Alerts.
Gap Scan
The Gap column in Discovery shows you the current gaps versus the prior day's close. As with all Discovery columns, Gaps is sortable simply by clicking on the heading label. Several strategies around gap trading typically garner attention and trade volume. Our implementation is based we compare the market open against the prior day close. This provides users with the ability to identify the breadth of the gap using our filter logic. In other words, you may track a gap from 1% (or dollar-based as chosen in Discovery settings) up to a higher percentage (e.g., 10% or dollar equivalent). Additionally, our logic is unique in that we account for gap fills and actively adjust the Gap value if trades begin to fade the action.
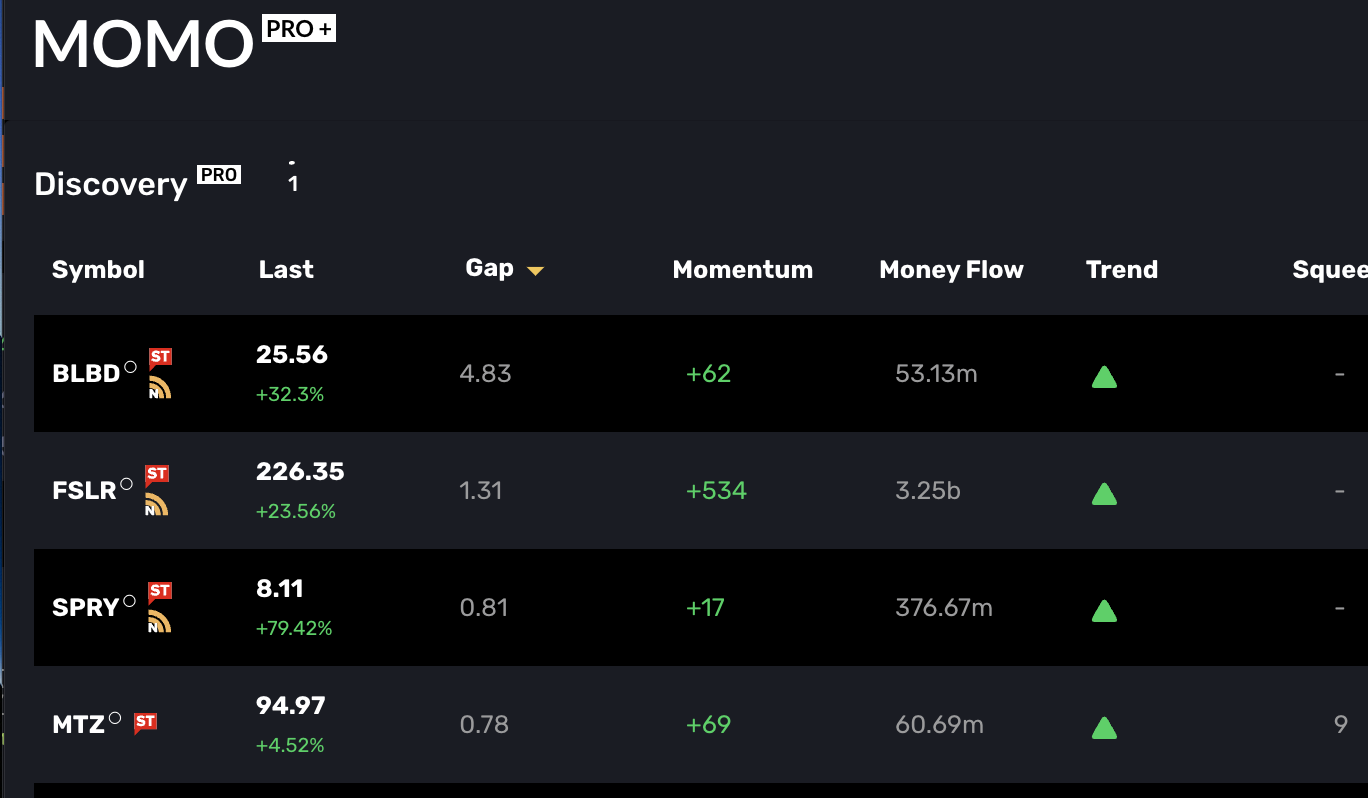
About Gap Scan. The Gap Scan is available to Pro+ traders in Stream as well. This means you may filter the Stream’s high/low breakouts with a certain Gap percentage. The Gap scan is also available as a parameter with Conditional Alerts. It's worth mentioning that our Gap Scan is available in pre-market and based on opening pre-market trade.
Money Flow
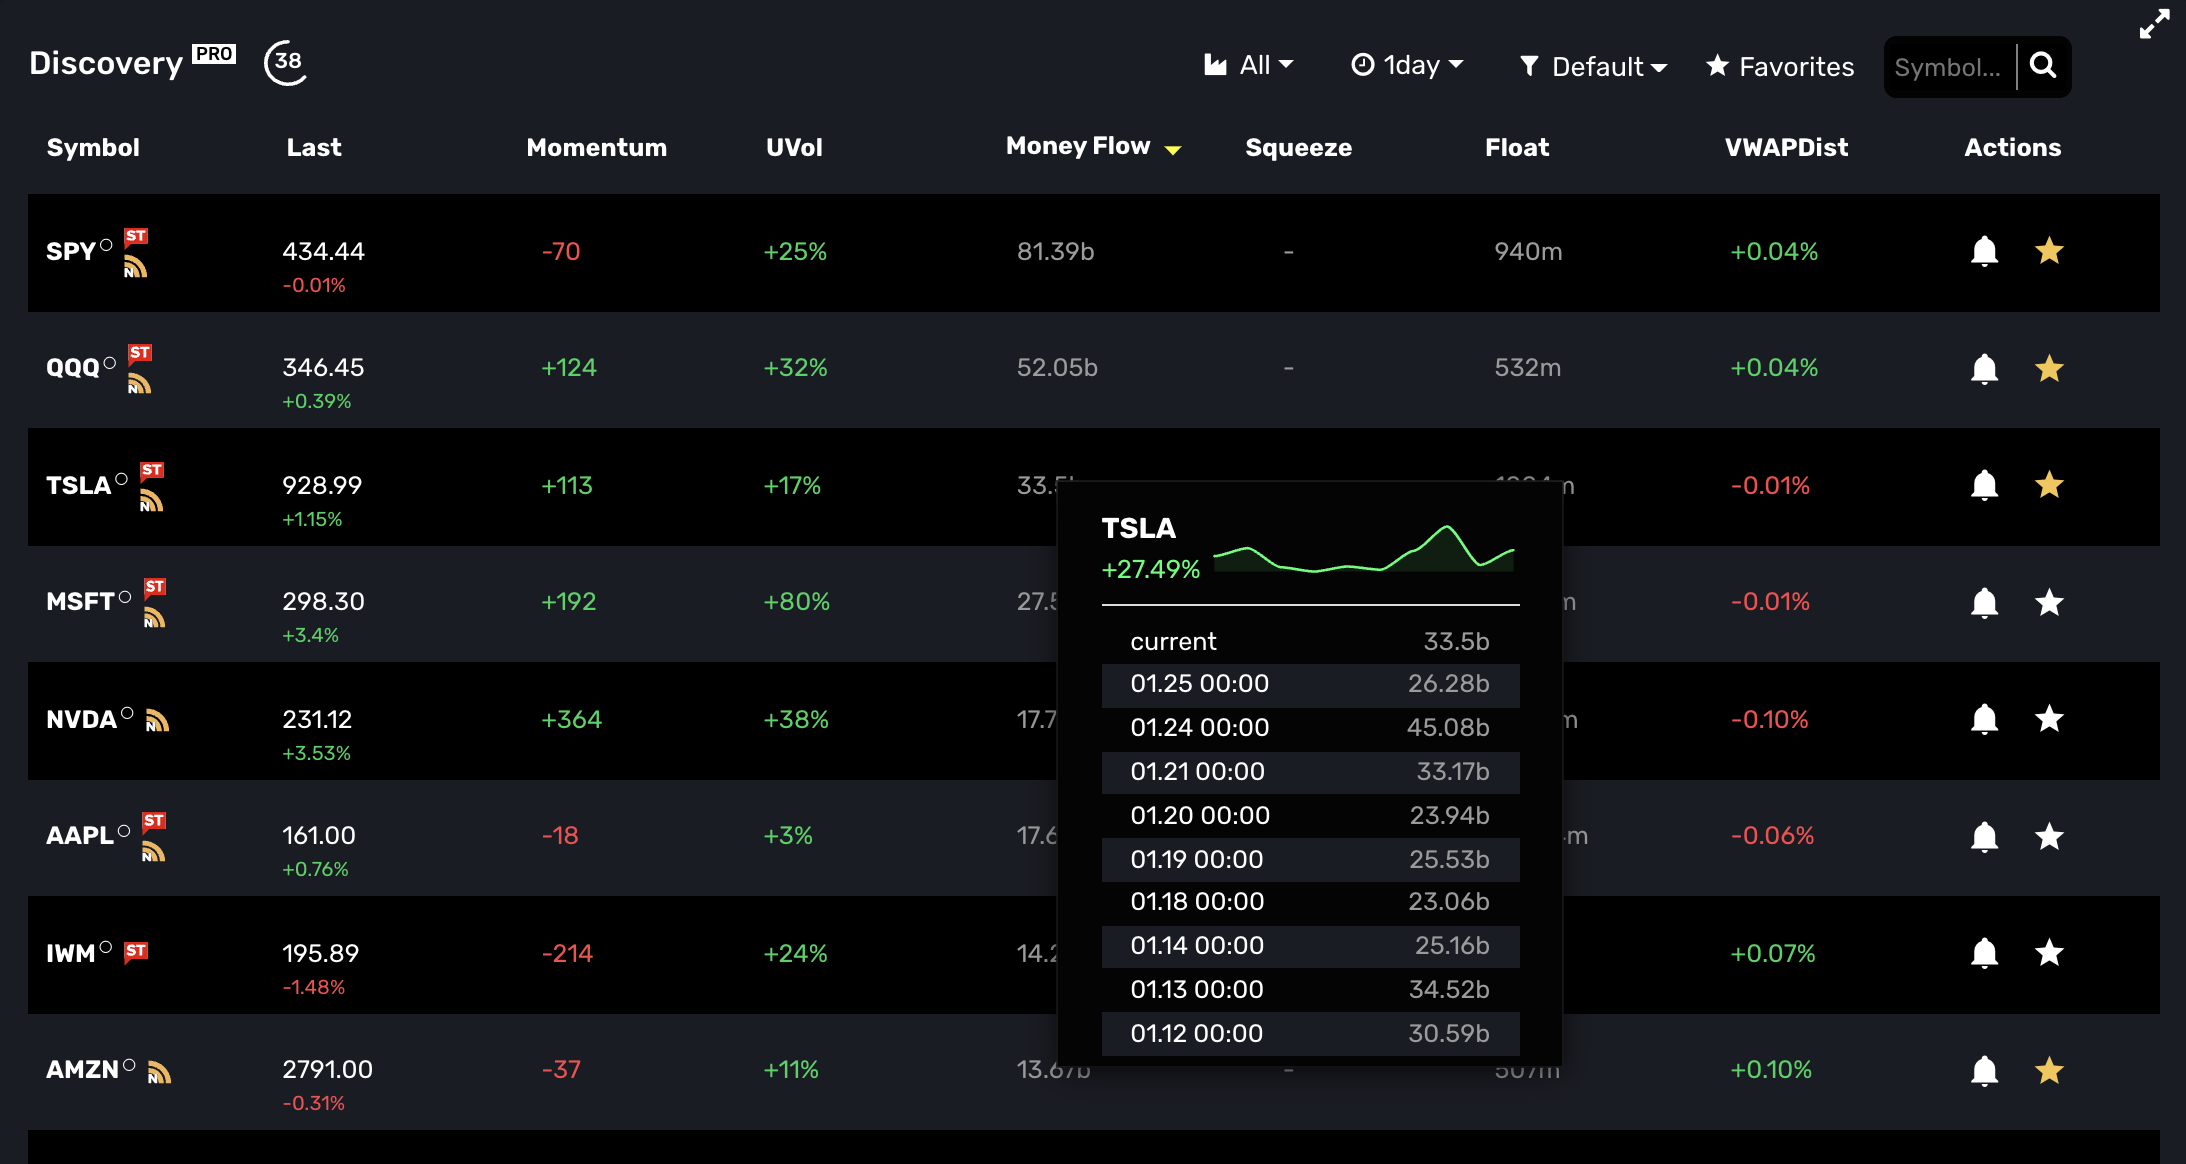
Money Flow provides a stock's true interest level relative to other stocks and its own historical flows over time. This is useful for assessing relative investment traded to track liquidity and interest. Our implementation is dynamically calculated per timeframe and updated every minute.
About Money Flow. The Money Flow calculation uses the relative timeframe VWAP-based price multiplied by the corresponding timeframe volume to determine the total Money Flow. This is also known as “Dollar Flow” or "Dollars Traded”. To use, click the column heading to sort and see those stocks with the most flow in the current period relative to all other stocks. If you click on a money flow value for a particular symbol, a pop-up showing the Money flow history of the current period vs. prior history will appear. The pop-up also shows the percent change of the current period vs. the most recent prior period. MoneyFlow is also an available filter in Discovery. There are two money flow filters available. You may choose to filter by the % change or the absolute dollar range.
Conditional Alert
Custom alerts built on your criteria. Where other MOMO alert types require a stock symbol, Conditional Alerts report the symbols which meet the set criteria. Conditional alerts may be configured using any or all of the available criteria, including avg volume, float, price, price change%, momentum, unusual volume, VWAPdist, moneyflow range, moneyflow change%, and MOMO squeeze.
About Conditional Alerts. Conditional alerts also use category and timeframe attributes in their definition. Understanding how the timeframe impacts the alerts is important. If the timeframe is set to 1 day and you wish to report all stocks moving more than 1%, then you will be notified based on the prior day's close for every 1% change. Repeated values are not included, but stocks which achieve an incremental 1% gain will be alerted. If the timeframe is set for 1 hour, the evaluation is similar to 1 day, but you are now scanning based on a 1% change versus the close on the prior hour. Alerted stocks will not be repeated unless they achieve an additional 1% gain. All conditional alerts are reported once every 3 minutes.
Webhook API
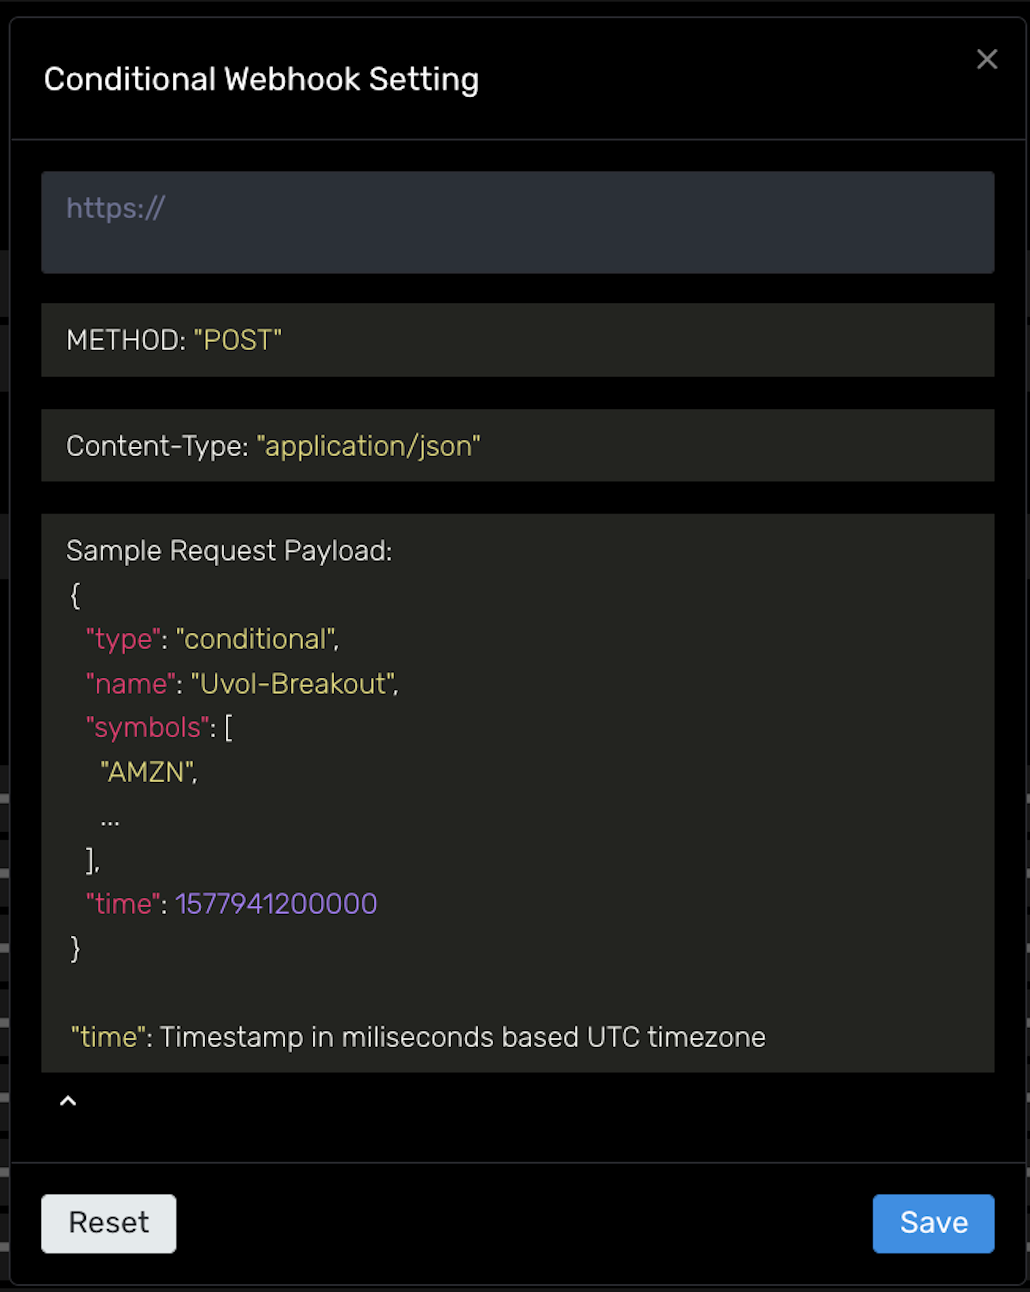
Directly integrate your alerts into your trading system or messaging tools. Every notification type can now be integrated via our webhook. This is particularly powerful when used with Conditional Alerts. MOMO Pro+ users will see the code link next to the alerts which support the Webhook API as shown below.

To use, put your the URL provided by your integration endpoint into the URL field as illustrated and save. The available API payload data is shown and is unique per alert type.
Useful Tip
It is important to note that TTM Squeeze has typically only been available while charting with a single symbol. To modify and provide our ranking and tabular scanning view we had to incorporate the presentation of the data in a meaningful way. We did this by creating 3 phases of MOMO Squeeze. The first phase is "PRE". This phase indicates stocks are currently in a squeeze pattern. For each timeframe "bar" the stock is in a squeeze we increment the count. So a PRE squeeze of 5 while viewing the 1hr timeframe would mean that the stock has been in a squeeze pattern for 5 hours. The "Now" phase highlights stocks which are currently "firing" a Squeeze breakout for the set timeframe. Lastly, the "POST" phase captures up to 5 post squeeze bars. These are illustrated as negative values. In the above Discovery image, you can see that PPSI is currently firing, while POLA is showing it is in ongoing Squeeze over the daily timeframe. This is notable because while POLA is having a sizable daily gain, its volatility dictates it has not broken the trend in a meaningful way. This is supported by the charts, which show high volatility and spikes only a few days prior. For a deeper illustration - Let's say AAPL is entering a tight trading range from 150 to 155 over 15 days, and MOMO Squeeze identifies this as a legitimate squeeze. On day 15, the PRE Squeeze count would show "15" on MOMO. The following day AAPL breaks out of squeeze and touches 157 and MOMO Squeeze validates this with a solid orange circle to show it is breaking out (aka firing). Two days later, you can see there was a recent breakout as the value is now post-breakout and has a value of "-2".
Last updated