> For the complete documentation index, see [llms.txt](https://doc.mometic.com/llms.txt). Markdown versions of documentation pages are available by appending `.md` to page URLs; this page is available as [Markdown](https://doc.mometic.com/momo-pro-user-guide/momo-pro-features.md).
# MOMO Pro Features
MOMO Pro includes several features to help uncover and track stock discoveries. The following sections detail the functionality for each.
### **MOMO Meters**
The MOMO Meters show a rolling market breadth over a 3 min period. Each row represents the current number of winners to losers for the Dow, Nasdaq, and SPY. How to use the MOMO Meters: Markets can change direction quickly and swings based on index percentage changes are slow to highlight this swing especially particularly since indexes are cap weighted.
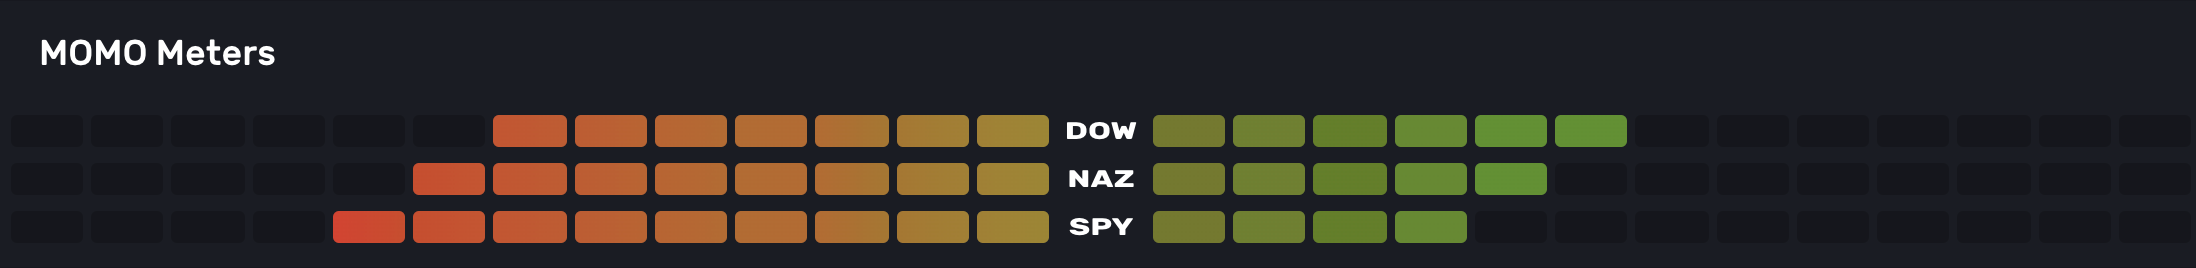
Located on the top of the MOMO screen, the MOMO Meters let you quickly identify market bias and flows. On either side of the MOMO logo are three sets of gauges. These gauges represent activity from top to bottom for the Dow, Nasdaq, and S\&P 500. Specifically, the MOMO Meters are a visualization of those making new intraday highs vs. lows. For example, if the S\&P 500 had a combined ten stocks making either a new high or low and 8 of them during the period were highs, the bottom MOMO Meter would be 80% green and 20% red.
### **Favorite Quotes**
Uncover a stock and add to quotes to keep tabs on the movement. If you add as a favorite in Discovery, it will automatically be added as a Quote. Quotes are integrated throughout MOMO Pro to help you track activity in Stream, News and Discovery.
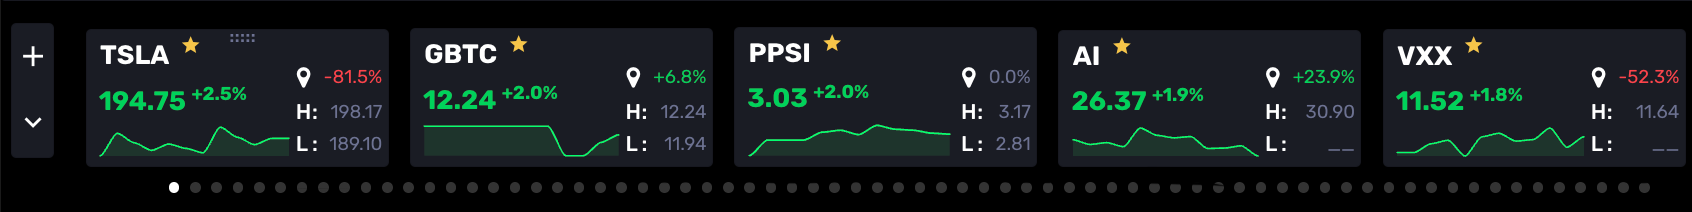
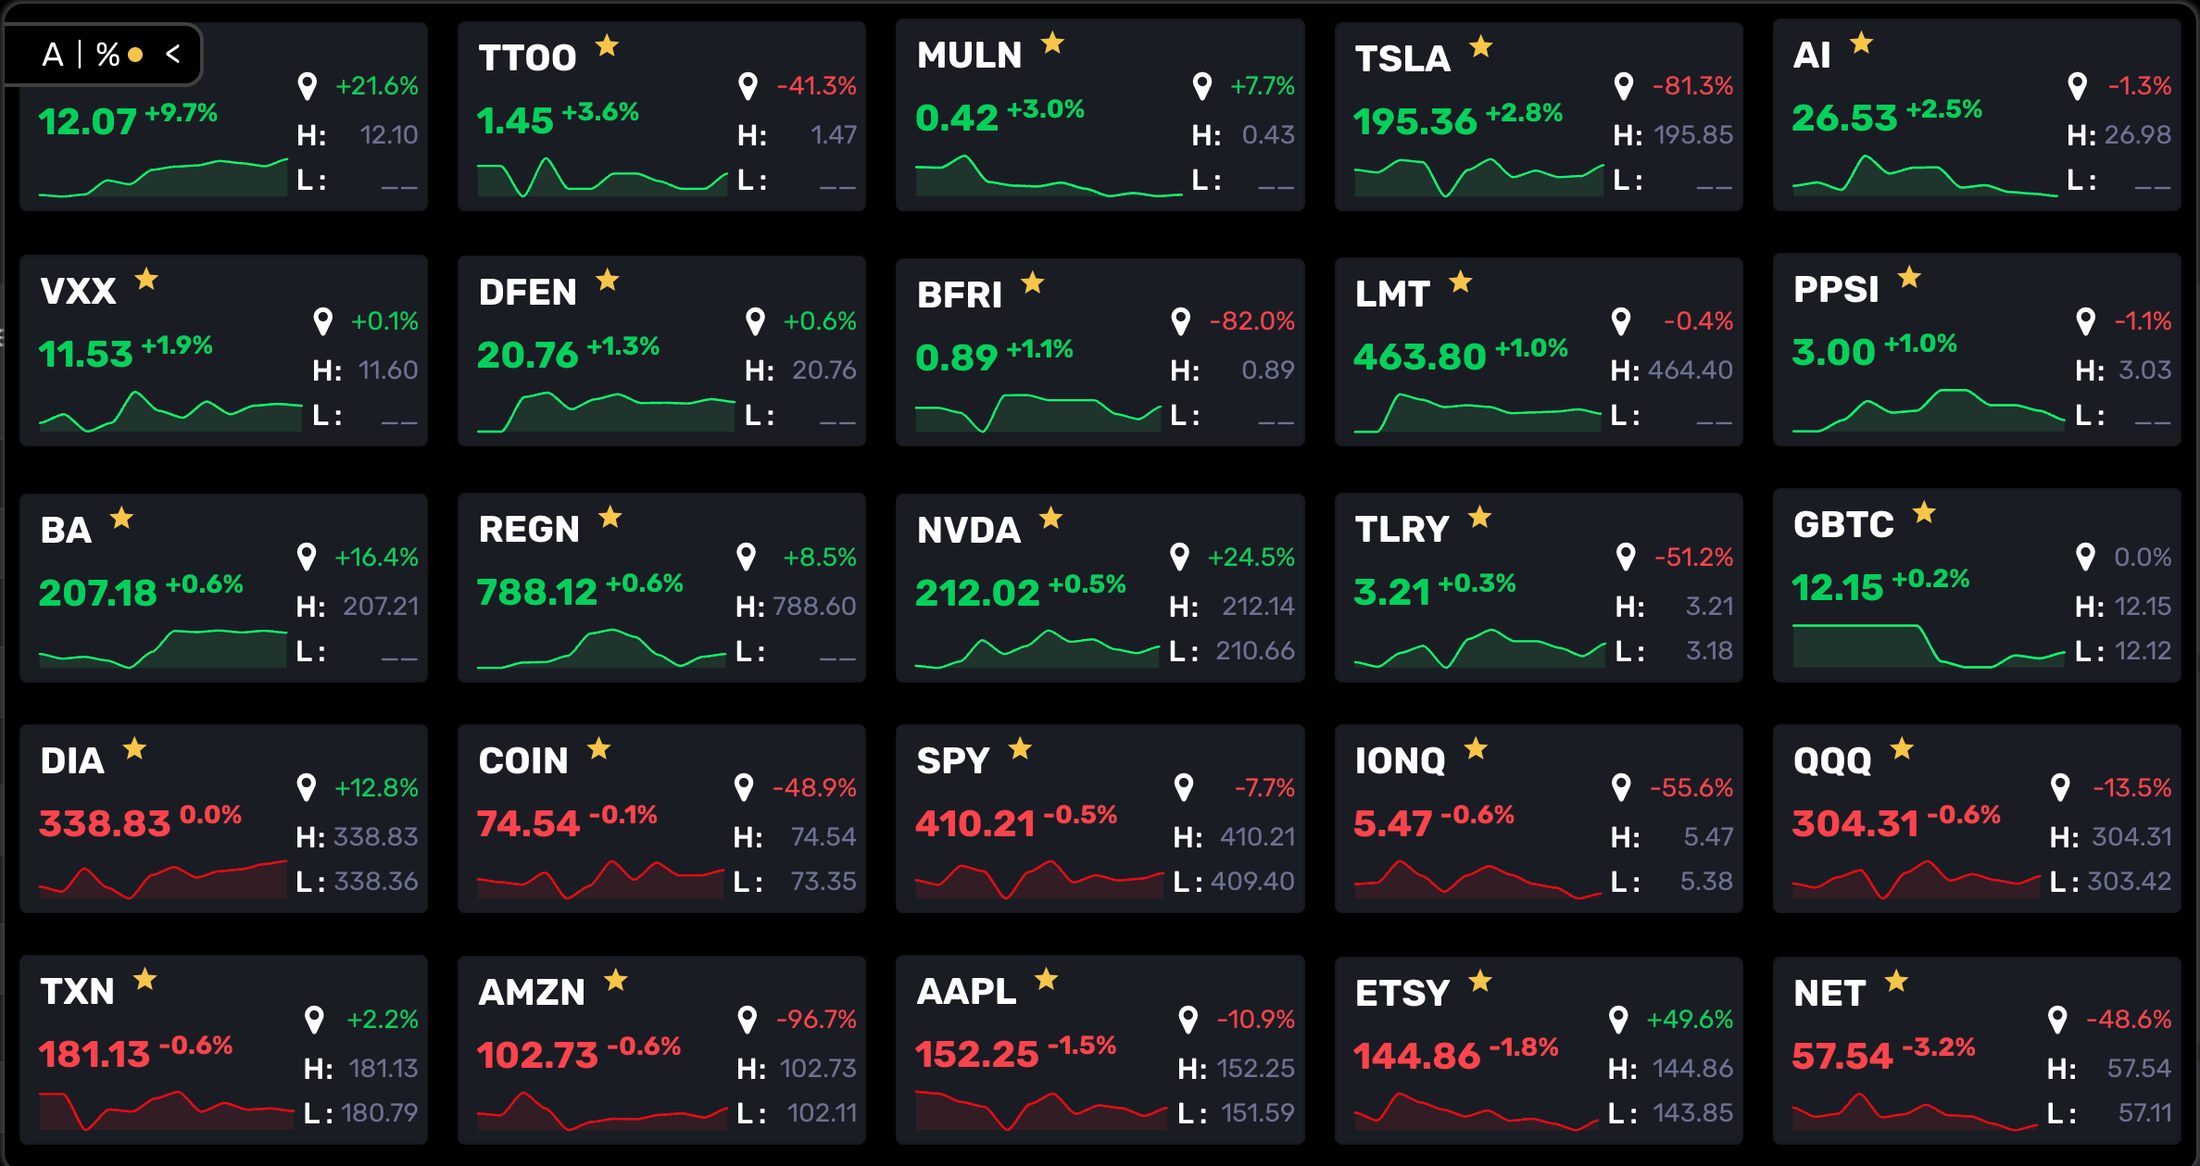
Swipe or drag left or right to review all quotes that have been added. To remove a quote select the star. To add a quote, click on the "+" indicator in the lefthand window. H and L are daily high and low values. The "Pin" icon represents the gain or loss since you started tracking the symbol and can be reset by clicking the icon.
The down arrow " " provides way to fully expand all quotes for quick reference as shown below. Tap the up arrow " " to collapse.
You may also change the sort order by expanding the control in top left corner as shown.
Expanded Favorite Quotes
### **MOMO Stream View**
The MOMO Stream scans for new highs and new lows in realtime. The Stream is divided into two columns. The red column on the left-hand side shows new lows for the day and the right-hand green column shows new daily highs.
MOMO Stream provides option for two different windows. By default, Stream 1 is set for Filter and the Stream 2 is disabled. When Stream 2 is enabled, configure as needed in Stream 2 Settings. You will have option to toggle between Streams as needed. After configuring the Stream 2 you can arrange size and arrange and save in the Layout Manager. See [Stream Settings ](broken://pages/bqC5qbvjLvdw5eP3CJ7U)for additional details.
The Halt bar highlights any current halts as well as when they resume (active for trading). Next to halted stocks is a timer to help track likely resumption time. In most instances limit halts resume in 5 minutes, with 10 minutes as the next resumption time point.

Both the left and right columns in the data stream display the following data:
* **Symbol** – Abbreviation used to uniquely identify publicly traded equity.
* **Count** - The number of times the particular symbol has reached a new intraday high or low.
* **Price** – Real-time last traded value in USD.
* **Socially Trending (ST)** - Indicates that the particular symbol has been recently trending on the stock platform Stocktwits. (e.g. AAPL in image above)
* **52 Week High and Lows** - 52 week events provides a powerful benchmark for breakout strength. MOMO visually highlights with solid green or red highlights behind the symbol.
* **Limit Up/Limit Down -** If subject to a halt due to volatile moves, LU/LD values will appear showing upper and lower halt values.
* **Optionable**- If enabled in settings, MOMO will identify stocks that support options with a small "o". The options settings also can completely remove stocks that do not support options with the "Filter" setting. (**Caution** - This setting is global and applies to Discovery as well. Many small float stocks will be removed if set to filter.)
* **Favorite** - If a favorite quote, a star icon is shown to help highlight the move.
* **News**- If related News, a news icon will be shown next to symbol. (e.g. PNNT & AAPL in image above)
{% hint style="info" %}
**Useful Tip:**
MOMO doesn’t differentiate whether the 52wk high/low is reached in normal trading hours or in extended hours, but will reset the 52 week value nightly based on what Nasdaq recognizes as the 52 week high or low. For example, if AAPL has a prior 52 week high of $178 and reaches $180.00 during premarket, MOMO will highlight that as a new 52 week high in the MOMO stream. But if during normal market hours AAPL only reaches $175 and, not a new 52week high, $178 will remain the 52 week high on record.
{% endhint %}
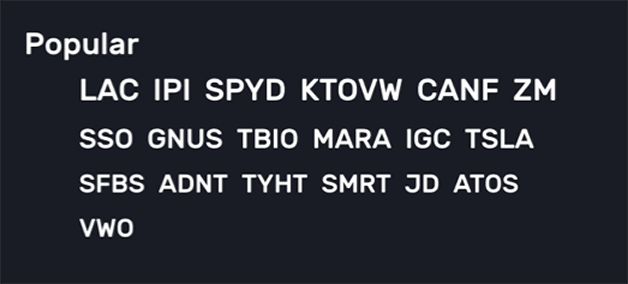
### **Popular**
MOMO is built to help highlight stocks stand out. Popular simply presents stocks which other users are actively researching and engaging with. Click on any the listed symbols to open the action window to research or set an alert.
### **Alert History**
Browser notifications are easy to miss and quickly disappear. Alert history solves this problem so you can review alerts as needed.

### **Stock News**
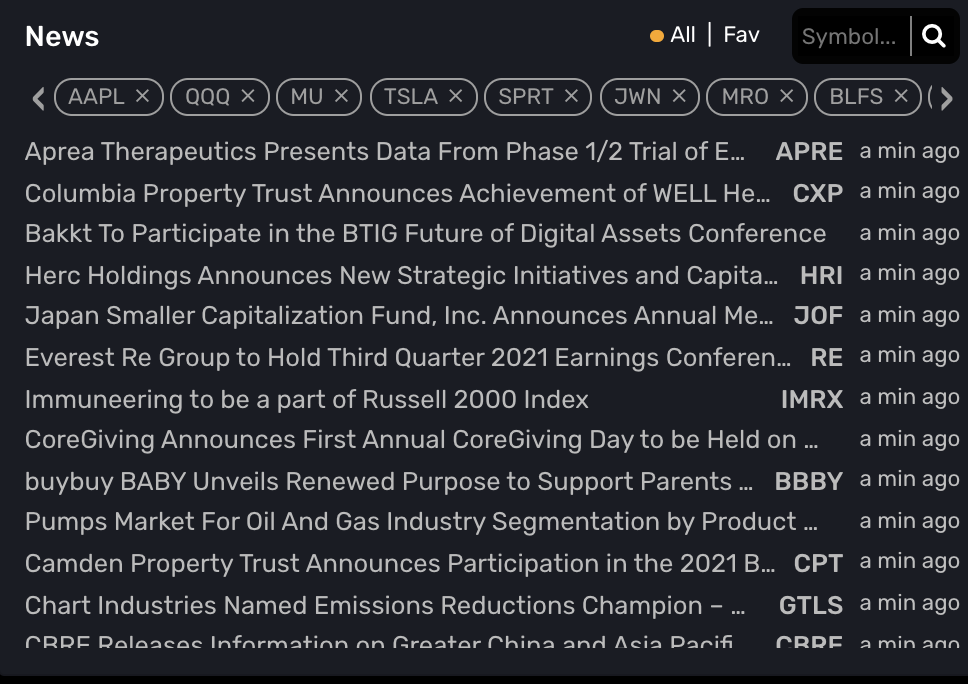
MOMO provides up to the second news on entire market, only your favorite quotes, any symbol searched upon, and automatically when any symbol is clicked on within the platform.
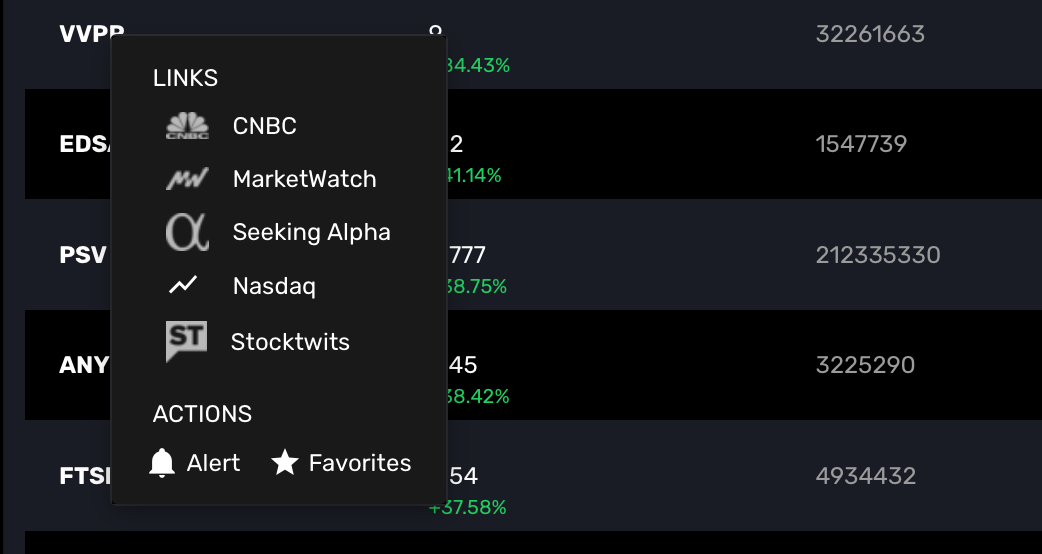
### **Quick Links**
Within MOMO you may launch popular media sources to help find news and data supporting the price movement. Once selected, MOMO will launch a new browser tab for the desired news and stock symbol.
You may also use the menu to add as a Favorite or quickly add an alert.
 ### **Quick Links**
Within MOMO you may launch popular media sources to help find news and data supporting the price movement. Once selected, MOMO will launch a new browser tab for the desired news and stock symbol.
You may also use the menu to add as a Favorite or quickly add an alert.

### **Quick Links**
Within MOMO you may launch popular media sources to help find news and data supporting the price movement. Once selected, MOMO will launch a new browser tab for the desired news and stock symbol.
You may also use the menu to add as a Favorite or quickly add an alert.
